Note
Go to the end to download the full example code.
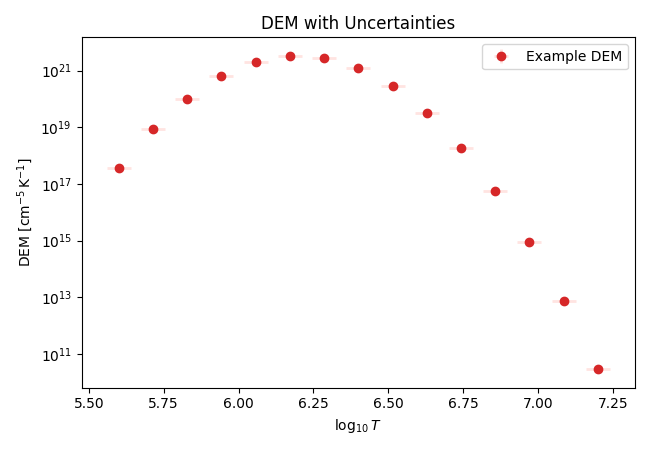
Plot a DEM Curve#
Plot a one-dimensional DEM curve with plot_dem.
import matplotlib.pyplot as plt
import numpy as np

from demregpy.plotting import plot_dem
plot_dem only needs temperature-bin centres and DEM values.
Optional horizontal and vertical uncertainties can be passed in the same call.
logt = np.linspace(5.6, 7.2, 15)
dem = 3.5e21 * np.exp(-((logt - 6.2) ** 2) / (2 * 0.14 ** 2))
elogt = np.full_like(logt, 0.04)
edem = 0.2 * dem
The helper adds the standard axis labels and logarithmic DEM scaling by default. This keeps small examples and quick-look plots concise.
fig, ax = plt.subplots(figsize=(6.5, 4.5))
plot_dem(
    logt,
    dem,
    elogt=elogt,
    edem=edem,
    ax=ax,
    color="tab:red",
    ecolor="mistyrose",
    label="Example DEM",
)
ax.set_title("DEM with Uncertainties")
ax.legend()

fig.tight_layout()
plt.show()
Total running time of the script: (0 minutes 0.152 seconds)