Note
Go to the end to download the full example code.
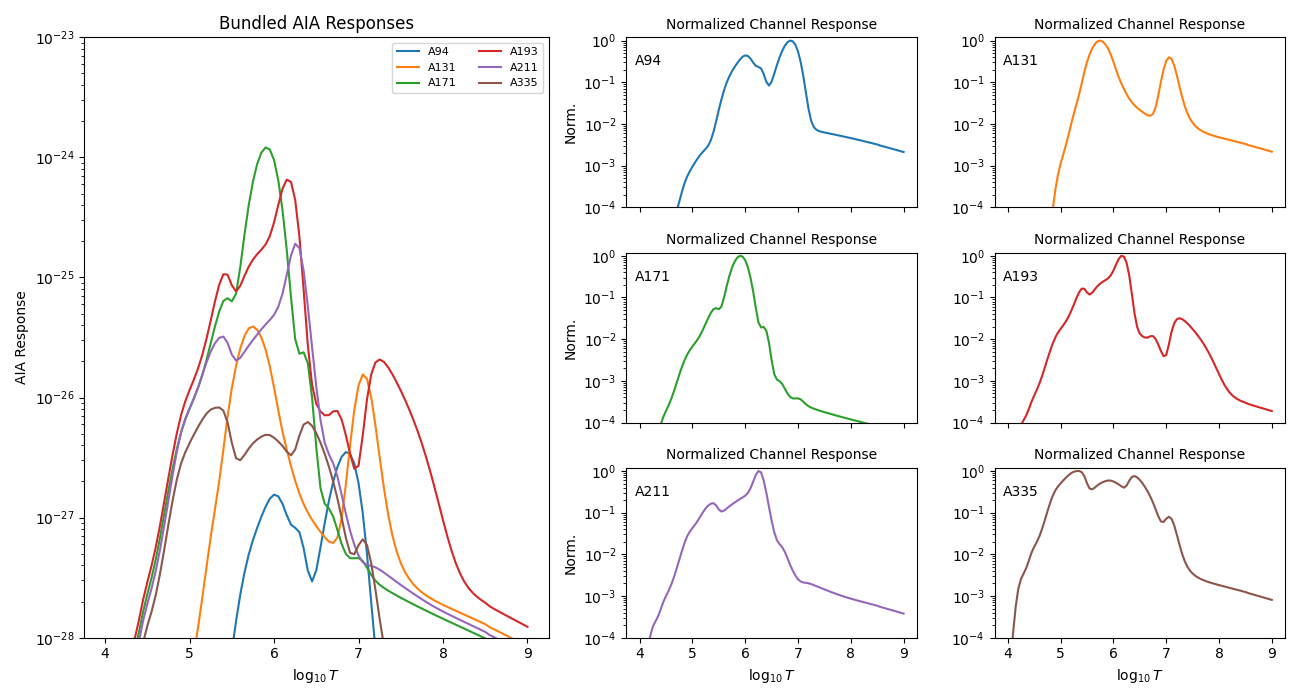
Plot AIA Response#
Load the bundled AIA temperature response file and plot the response curves.
import matplotlib.pyplot as plt
import numpy as np

from demregpy import load_aia_response
The bundled response file is returned as channel labels, a log-temperature grid, and a response matrix.
The response can be plotted directly into dn2dem.
channels, tresp_logt, trmatrix = load_aia_response()

print("Channels:", channels)
print(f"Temperature range: logT={tresp_logt.min():.2f} .. {tresp_logt.max():.2f}")
print("Response matrix shape:", trmatrix.shape)
Channels: ['A94', 'A131', 'A171', 'A193', 'A211', 'A335']
Temperature range: logT=4.00 .. 9.00
Response matrix shape: (101, 6)
AIA has broad and overlapping temperature responses. The raw overlay shows their absolute scale. Small normalized panels make it easier to compare the temperature coverage of each channel without the overplot becoming unreadable.
fig = plt.figure(figsize=(13, 7))
gs = fig.add_gridspec(3, 3, width_ratios=[1.6, 1, 1])

ax_main = fig.add_subplot(gs[:, 0])
small_axes = [fig.add_subplot(gs[i, j]) for i in range(3) for j in range(1, 3)]

for i, channel in enumerate(channels):
    response = trmatrix[:, i]
    ax_main.plot(tresp_logt, response, label=channel)
    small_axes[i].plot(tresp_logt, response / np.max(response), color=f"C{i}")

ax_main.set_xlabel(r"$\log_{10} T$")
ax_main.set_ylabel("AIA Response")
ax_main.set_yscale("log")
ax_main.set_ylim(1e-28, 1e-23)
ax_main.set_title("Bundled AIA Responses")
ax_main.legend(fontsize=8, ncol=2)

for ax, channel in zip(small_axes, channels):
    ax.set_yscale("log")
    ax.set_ylim(1e-4, 1.2)
    ax.set_title("Normalized Channel Response", fontsize=10)
    ax.text(0.03, 0.90, channel, transform=ax.transAxes, va="top")

for ax in small_axes[:4]:
    ax.set_xticklabels([])

for ax in small_axes[::2]:
    ax.set_ylabel("Norm.")

for ax in small_axes[-2:]:
    ax.set_xlabel(r"$\log_{10} T$")

fig.tight_layout()
plt.show()
Total running time of the script: (0 minutes 1.104 seconds)