Note
Go to the end to download the full example code.
Plot AIA Loci Curves#
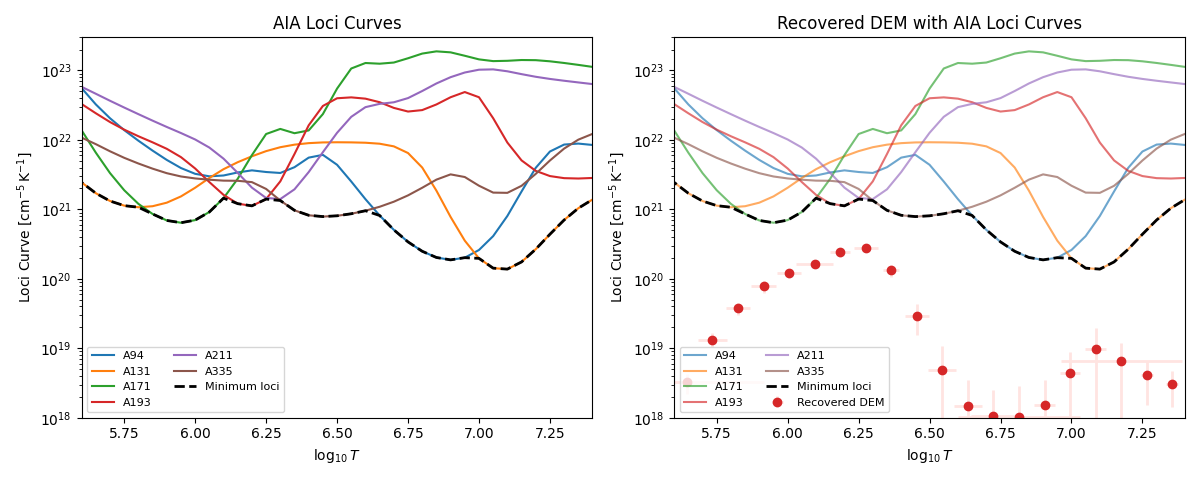
Loci curves show the maximum DEM consistent with a single channel’s count rate at each temperature. The minimum envelope across all channels gives the tightest upper bound on the DEM from the data alone, without any regularisation. Overlaying these curves on a recovered DEM is a quick sanity check: a good solution should sit at or below the loci envelope everywhere.
import matplotlib.pyplot as plt
import numpy as np

from demregpy import dn2dem, load_aia_response
from demregpy.plotting import plot_dem, plot_loci_curves
from demregpy.tests.example_data import load_aia_full_disk_maps
AIA loci curves are a quick way to see which temperatures are constrained by a given set of channel counts. The same curves can be overplotted on a recovered DEM to show the loci upper bound implied by the data.
maps = load_aia_full_disk_maps()
rate_maps = [amap / amap.exposure_time for amap in maps]
channels, tresp_logt, trmatrix = load_aia_response()

x = 500
y = 500
dn_in = np.array([amap.data[x, y] for amap in rate_maps], dtype=float)
edn_in = 0.1 * dn_in + 1

temps = 10 ** np.linspace(5.6, 7.4, num=21)
mlogt = 0.5 * (np.log10(temps[:-1]) + np.log10(temps[1:]))

dem, edem, elogt, chisq, dn_reg = dn2dem(
    dn_in,
    edn_in,
    trmatrix,
    tresp_logt,
    temps,
    nmu=40,
    warn=False,
)

print("Input DN / pix / s:", dn_in)
print(f"chi-squared: {chisq:.3f}")
Input DN / pix / s: [  0.58173286   2.86508804  76.64044305 128.21785248  57.07439864
   1.48666039]
chi-squared: 1.008
The first panel shows the AIA loci curves by themselves. The second panel overlays the same loci curves on the recovered DEM. The minimum loci curve gives the strongest upper bound from the channel set.
fig, axes = plt.subplots(1, 2, figsize=(12, 4.8))
xlim = (np.log10(temps[0]), np.log10(temps[-1]))

plot_loci_curves(
    tresp_logt,
    dn_in,
    trmatrix,
    channels=channels,
    ax=axes[0],
)
axes[0].set_title("AIA Loci Curves")
axes[0].set_xlim(*xlim)
axes[0].set_ylim(1e18, 3e23)
axes[0].legend(fontsize=8, ncol=2)

plot_dem(
    mlogt,
    dem,
    elogt=elogt,
    edem=edem,
    ax=axes[1],
    color="tab:red",
    ecolor="mistyrose",
    label="Recovered DEM",
)
plot_loci_curves(
    tresp_logt,
    dn_in,
    trmatrix,
    channels=channels,
    ax=axes[1],
    alpha=0.65,
)
axes[1].set_title("Recovered DEM with AIA Loci Curves")
axes[1].set_xlim(*xlim)
axes[1].set_ylim(1e18, 3e23)
axes[1].legend(fontsize=8, ncol=2)

fig.tight_layout()
plt.show()
Total running time of the script: (0 minutes 0.535 seconds)