Note
Go to the end to download the full example code.
AIA Patch Inversion#
Run dn2dem on a small AIA patch and inspect the resulting DEM cube.
import matplotlib.pyplot as plt
import numpy as np

from demregpy import dn2dem, load_aia_response
from demregpy.tests.example_data import load_aia_full_disk_maps
Extract a submap from each AIA channel and convert to count rates.
The final array has shape (nx, ny, nf) with channels on the last axis.
No additional time-dependent degradation correction is applied here.
maps = load_aia_full_disk_maps()
rate_maps = [amap / amap.exposure_time for amap in maps]
_channels, tresp_logt, trmatrix = load_aia_response()

# Define the patch pixel coordinates
width = 10
height = 10
nx, ny = maps[0].data.shape
x0 = nx // 2 - width // 2
y0 = ny // 2 - height // 2
x1 = x0 + width
y1 = y0 + height

# create the input array
dn_in = np.stack(
    [amap.data[x0:x1, y0:y1] for amap in rate_maps],
    axis=-1,
).astype(float)
edn_in = 0.1 * dn_in + 1

# The temperature grid for the inversion
temps = 10 ** np.linspace(5.6, 7.4, num=21)
mlogt = 0.5 * (np.log10(temps[:-1]) + np.log10(temps[1:]))
The dn2dem call is identical for a single spectrum or an n-dimensional grid.
Each pixel is solved independently; output spatial axes match the input, with temperature replacing channel.
dem, edem, elogt, chisq, dn_reg = dn2dem(
    dn_in,
    edn_in,
    trmatrix,
    tresp_logt,
    temps,
    nmu=40,
    warn=False,
)
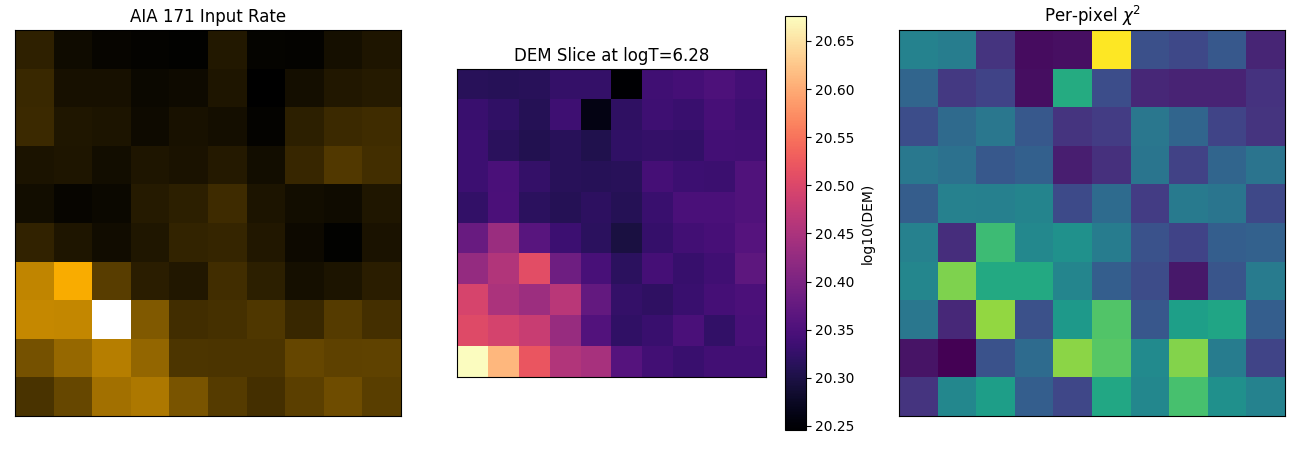
A temperature slice near the peak of the patch-averaged DEM, alongside one input channel and per-pixel chi-squared.
fig, axes = plt.subplots(1, 3, figsize=(13, 4.5))

axes[0].imshow(dn_in[:, :, 2], origin="lower", cmap="sdoaia171")
axes[0].set_title("AIA 171 Input Rate")

peak_bin = int(np.argmax(np.mean(dem, axis=(0, 1))))
peak_logt = mlogt[peak_bin]

im = axes[1].imshow(np.log10(dem[:, :, peak_bin] + 1e-30), origin="lower", cmap="magma")
axes[1].set_title(f"DEM Slice at logT={peak_logt:.2f}")
fig.colorbar(im, ax=axes[1], label="log10(DEM)")

axes[2].imshow(chisq, origin="lower", cmap="viridis")
axes[2].set_title(r"Per-pixel $\chi^2$")

for ax in axes:
    ax.set_xticks([])
    ax.set_yticks([])

fig.tight_layout()
plt.show()
Total running time of the script: (0 minutes 0.259 seconds)